Thursday, December 10, 2015

Multi-Value Performance Tile

This post is a bit of a diversion from my working with Maps since it revolves around a requirement I had with a client.

We have all seen the Performance Tile.  It provides a quick instant view of key metrics.


We can use conditional formatting to indicate a change from target or values within a threshold.  The one limitation of a Performance Tile is that it holds 1 and only 1 value.

What if you wanted to show a tile with Current Value as well as Month Ago Value and Year Ago Value so that you could quick see how you are performing in context of time?


I had such a request from a client. And after some playing around I figured why try to do this with a Pivot or other visualization.  Why not use a couple of tiles in the compound view and when put on the Dashboard the tile looks whole and tells a better story than a single value.
 
 First I looked at the original Tile to get an idea about the size.
 
 
Then I adjust the size so that it is about 2/3 the original height


Next I modify my Analysis to bring in the other 2 values.
 

Then create 2 new tiles with the height 1/3 the original height.  The key to this working is also adjusting the font sizes and checking the option Do Not Autofit.

 
Finally I put it all together in my compound layout.


 Then on the Dashboard next to the original tile.


All it takes now is a bit of fine tuning.
 
Well that was fun, until next time.


Sunday, September 27, 2015

SQLDeveloper and Map Data - part 2

In my last post SQLDeveloper and Map Data I showed how one can view Map Geometry Columns using SQL Developer. 

In the last part of the post I showed regions of the United States made up a number of states.
 

And the SQL statement identifying those regions made reference to a Region ID in  the TL_2014_US_STATE  geometry table.

Using this information and a Spatial function within the database wecan make a new geometry table with Regions allowing a user to drill through Maps as they would on a Dimension in a pivot.

Region
 - State
   - County

Creating new aggregated geometry from existing geometry table can be done in 5 simple steps:

1.Create New Table with Geometry Column and at least one key column
2.Update Oracle Spatial Metadata
3.Load data into new table using sdo_aggr_union Function
4.Create Spatial Index on new table
5.View new table / Custom Region

So let's get started.  We will connect to our MVDATA schema where we have our TL_2014_US_STATE table of US States with the Region Column.

First Create the New Table


create table us_custom_regions (
  region_id varchar2(2),
  region_name varchar2(15),
  region_name_caps varchar2(15),
  geometry mdsys.sdo_geometry);
commit;

Update the Oracle Spatial Metadata

This can be done via Right Mouse Click on the new table and bringing up the Spatial menu and selecting Update Spatial Metadata


Enter 8307 for the coordinate system identifier. Add two rows for the spatial dimensions and enter the values Longitude, -180, 180, 0.05 and Latitude, -90, 90, 0.05


This interface makes entries into the user_sdo_geom_metadata table

The SQL insert statement for the above action is:

Insert into user_sdo_geom_metadata values ('S_REGIONS', 'GEOMETRY',
mdsys.sdo_dim_array(mdsys.sdo_dim_element('Longitude', -180, 180, 0.05
),
mdsys.sdo_dim_element('Latitude', -90, 90, 0.05)), 8307);

commit;
   

Load Data

 
We will source our TL_2014_US_STATE table of the US States and aggregate the geometry into one shape per region using the SDO_AGGR_UNION function within the database.

The SQL for selecting and loading the data is below

INSERT INTO US_REGIONS
select '1', 'East', 'EAST', sdo_aggr_union(sdoaggrtype(geometry, 0.05)) FROM US_STATE WHERE REGION = '1';
INSERT INTO US_REGIONS
select '2', 'Central', 'CENTRAL', sdo_aggr_union(sdoaggrtype(geometry, 0.05)) FROM US_STATE WHERE REGION = '2';
INSERT INTO US_REGIONS
select '3', 'South', 'SOUTH', sdo_aggr_union(sdoaggrtype(geometry, 0.05)) FROM US_STATE WHERE REGION = '3';
INSERT INTO US_REGIONS
select '4', 'West', 'WEST', sdo_aggr_union(sdoaggrtype(geometry, 0.05)) FROM US_STATE WHERE REGION = '4';
COMMIT;
 

Create Spatial Index


The Spatial index is created by invoking the Spatial Menu and selecting Create Spatial Index.


Provide a Name.


Again the actions done via the GUI can be done using SQL Statements.  The create spatial index SQL statement for the above screen is shown below
 
CREATE INDEX MV_US_REGION_SPINDX ON "MVDATA"."US_REGIONS"("GEOMETRY") INDEXTYPE IS MDSYS.SPATIAL_INDEX
 

Viewing New Map Data

Bring up the Map Viewer within SQL Developer
  

 Create a SQL Statement

And view the results


 My next post will look at bringing this all together and incorporating in OBIEE.
 

Friday, July 31, 2015

SQLDeveloper and Map Data

In my post Software Used in Spatial, I listed Oracle SQL Developer as a tool I use when working with Maps and Map data.

Very little has been written with regards to MapView within SQL Developer.  The most recent I could find was a post by Jeff Smith in 2011 Visualize Spatial Data with SQL Developer.

I use SQLDeveloper for a number of purposes when working with Maps.

  • Viewing the geometry and attribute/metadata columns that came with the map data.
  • Adding or removing attribute columns.
  • Creating custom geometry via Spatial Functions.


Viewing Attribute columns

Take for instance the Map Shapefiles that are available from the U.S. Census.  Depending on the file you select you could have a lot of Descriptive Attributes.

The TIGER/Line Shapefile indicates that it is very Descriptive


We can see that there a quite a number of attribute columns.


Some that may be helpful in other exercises are the INTPTLAT and INTPTLON which are the center point (Latitude &longitude) of the state.


Where as the Cartographic Boundary Shapefiles indicate it has limited attribute information.


Adding/Removing Attribute Columns

Regardless of the file used many of the columns are not necessary for what we need in working with maps in OBIEE.  In most cases I delete the not needed columns. and will often add other columns for linking to OBIEE data such as State name in all uppercase. 


In the case of County level maps, if you are not going to use the State & County FIPS ID to link to OBIEE data you may need to concatenate the State Name in front of or at the end of the County Name since there are states that have counties with same name.  It really depends on the data you have in OBIEE.


Viewing Maps in SQLDeveloper

SQLDeveloper allow for a developer to view the Geometry data. 

The Geometry for a single row can be viewed by right clicking in the Geometry data cell and selecting Display geometry shape...


If you noticed in the TIGER/Line shape data there were 2 columns - Region and Division.


If a results set has a geometry column another right click option is available.

 
 This will open the Map View and display the results as a map.


Alternately from the View menu select Map View


The Map View window will open and a query can be written to display a map.


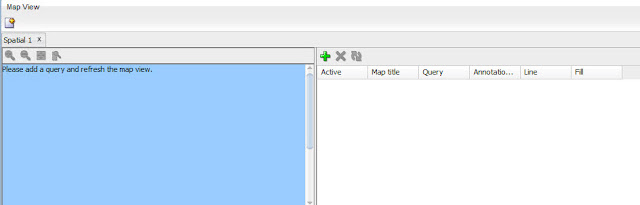
By Clicking on the green plus sign we get the query window. 


when the query is executed in the Map View we see that Region 1 is the New England states.


Now if 3 more queries are built for the other Regions we can see the rest of the US.


This leaves us to the last item in my list that I use SQLDeveloper with map data.  And that is the topic for another post...

Saturday, June 20, 2015

Let KScope15 Begin!!

This post will not focus on solving a technical problem directly, though many who attend the Oracle Developer Tools User Group, ODTUG, annual conference KScope often leave with many ideas for solving technical problems.
 
I have been attending KScope since 2010.  I was looking for a conference to replace what I got from the Hyperion Conferences which ended when Oracle acquired Hyperion.  Back in 2009 I started searching for where all the people I knew from my days attending the Hyperion Conference were going.  At that time it seemed many where like me looking for a new "conference home".  I heard about Collaborate and Kaleidoscope and quite frankly in 2010 the Kaleidoscope was a better fit in my calendar.   
 
That conference in 2010 was held in Washington DC and what an experience it was.  I met so many great people learned a lot and wanted more.  So much that when at the closing ceremony when it was announced that if anyone registered for the next year by the end of the month they would be guaranteed the lowest possible rate I went back to my room and locked in for 2011 in Long Beach.  I have continued to lock in the next year's conference being the first to register before the end of the current conference. 
 
Over the past years I have become more and more involved in the conference and ODTUG.  This will be my 3rd year as a presenter.  Additionally I have served on the Business Intelligence (BI) Track Content selection committee for 3 years and this past year was the BI Track Content Lead working with a great team of volunteers to pour over 160 submissions to pick 28 for the KScope 2015 Conference.  I don't make these statements to brag but rather illustrate how much value I put into what ODTUG and KScope represent.

So, as I write this post on KScope Eve after having participated in my 6th KScope Community Service Day I am excited for what the next 5 days will hold.

Sunday, June 21, we have the Oracle Symposiums and this past year I have been working with folks within the BI Space at Oracle and they have really put together some great presentations.

Monday through Wednesday will be packed with great content not only on the BI Track but also on the Database, EPM, APEX and ADF tracks.

Finally Thursday we wrap with the continuation of something started last year...the Deep Dives.  On the BI side a great group of guys from 3 different companies have put together a great session on Big Data.

Aside from all the educational sessions there is also some room for fun.  The various vendor breaks in the exhibit hall, evening receptions, Monday Night events, Werewolf and finally the Closing Party on Wednesday night which each year attempts to out do the prior.

So if you are attending this year's KScope conference please look for me and introduce yourself.  If you are thinking about attending next year keep an ear out because they announce the location Monday at the General Session.  Then start checking all the blogs and posts about what people are hearing and seeing this year.

I truly think it is the best conference and investment in one's professional development.

Tuesday, May 5, 2015

Creating A Geometry Theme

To create a Geometry Theme which will be used as a Layer in OBIEE work will be done in MapBuilder. 

This is broken into three parts:
  • Creating a Style
  • Creating a Geometry Theme
  • Modifying Geometry Theme

Creating a Style

A Geometry Theme can be created without a style, but the style helps with the display when brought into OBIEE.

The styles help highlight portions of a map.  Since this is a new map data source there are no styles.

 
The built in Help has a very informative section on Styles.
 

A review of the styles in the OBIEE Sample App v406 will show a variety of styles for the many maps.
 
 
These styles are maintained in the USER_SDO_STYLES view of the Oracle database that was identified in the Map Viewer datasource configuration.
 
For the Geometry Theme that will be used in OBIEE the only style that is needed is the Line to show the borders of the states.  If a State Name or Abbreviation is need to be displayed then Texts style will also be needed.  In this scenario a simple Black line will be used to show state borders. 
 
Connect to the MVDATA and then expand the upper structure.
 
Right Click on Lines and select Create Line Style.
 
 
In the New Line Style properties pane provide a name for the Style.  The standard naming convention for styles is to prefix the name with the first letter of the style.  I will also then indicate the color and thickness of the line.  The Description is optional but helpful.
 
 
 Finally the style needs to be saved so that it is written to the the database and available for use.
 
 
Now that a style is defined a Geometry theme can be created.
 
 
Creating a Geometry Theme
 
Click on the Show Data in the lower left of the screen and navigate to the Geometry data that was uploaded in Working with 3rd Party Shapefiles.  Right Click on the table and select Create Geometry Theme.
 

The Create Geometry Wizard will open.


Step 1: Provide a Name for the Theme.  Note do not use spaces in the name.

 
Step 2: Apply a Style that was created earlier


Step 3: If a label is needed then apply the Text Style and the attribute associated with the Geometry that will be displayed. This option can be added to the Theme later if necessary.

 
Step 4: Apply a query condition to the Geometry table.  For example if the Geometry data for the United States included the Territory of Puerto Rico and it needed to be excluded from the Geometry Theme the condition would contain NAME <> 'Puerto Rico'.  For this example it will remain blank.  This option can be added to the Theme later if necessary.

 
A final review of the Theme is presented.  Click Finish.
 
 
Once created the Theme will appear in the list and the Properties panel will be visible.

 
The Style Rules panel can be updated as per needs.

 
The Advanced panel is what will be updated so as to provide link to OBIEE data.

 
To View the map click on the Preview tab at bottom of screen and click the Green Play button on the preview panel.


Use the Pan/Zoom and Identify buttons just as when previewing the Geometry table that was uploaded from the shapefile.


Modifying a Geometry Theme 
 
The Advanced Tab allows for creating linkage between Geometry Theme and OBIEE.  The RowID is the current Key Column which denotes a unique row in the theme.  This can be updated to any attribute column in the data and I will often set it to the State FIPS code (STATEFP) or the GEOID column.
 

At this point is helpful to know the data within OBIEE.  Use the using the Identify tool in the preview panel to review the Theme Attributes. A common link is on State Abbreviation or State Name.  Also note that case matters when joining data.
 
 
To add Info Columns that will be used to join to OBIEE data Click the small pencil in the lower left corner of the Advanced panel.
 
In the Edit Info Columns click the Add button
 

Select the columns and provide appropriate names.  Note do not use spaces in the Name column.


The Advanced panel will now have the 2 new Info Columns.

 
Save the modifications.
 
Now we are ready to bring the Geometry Theme into OBIEE and use in a Map View.  That is the topic of a different post.